

What does each metric answer?
Which one should you watch?
Start with Visibility Score. It’s the headline number on your dashboard, and it has to move before the others mean much. You can’t rank well in an answer you’re absent from. Once you’re named consistently, share of voice becomes the more useful number. It’s the only one of the four that accounts for what your competitors are doing. Treat position and sentiment as quality checks on the first two. High visibility with a weak position means you’re the afterthought in every list. High visibility with negative sentiment is worse than not being named.Where do the numbers come from?
Every metric comes from captured answers, not from estimates or modeling. FixAEO asks each AI engine your tracked prompts, reads the answer a real user would see, and counts what’s in it. That makes your prompt list the denominator behind all four numbers. Get it right first — see Setting up your prompts. Because every engine is asked separately, some numbers can also be read one engine at a time. Visibility Score splits per engine on the AI engines tab, and share of voice splits behind the engine filter on the Industry tab: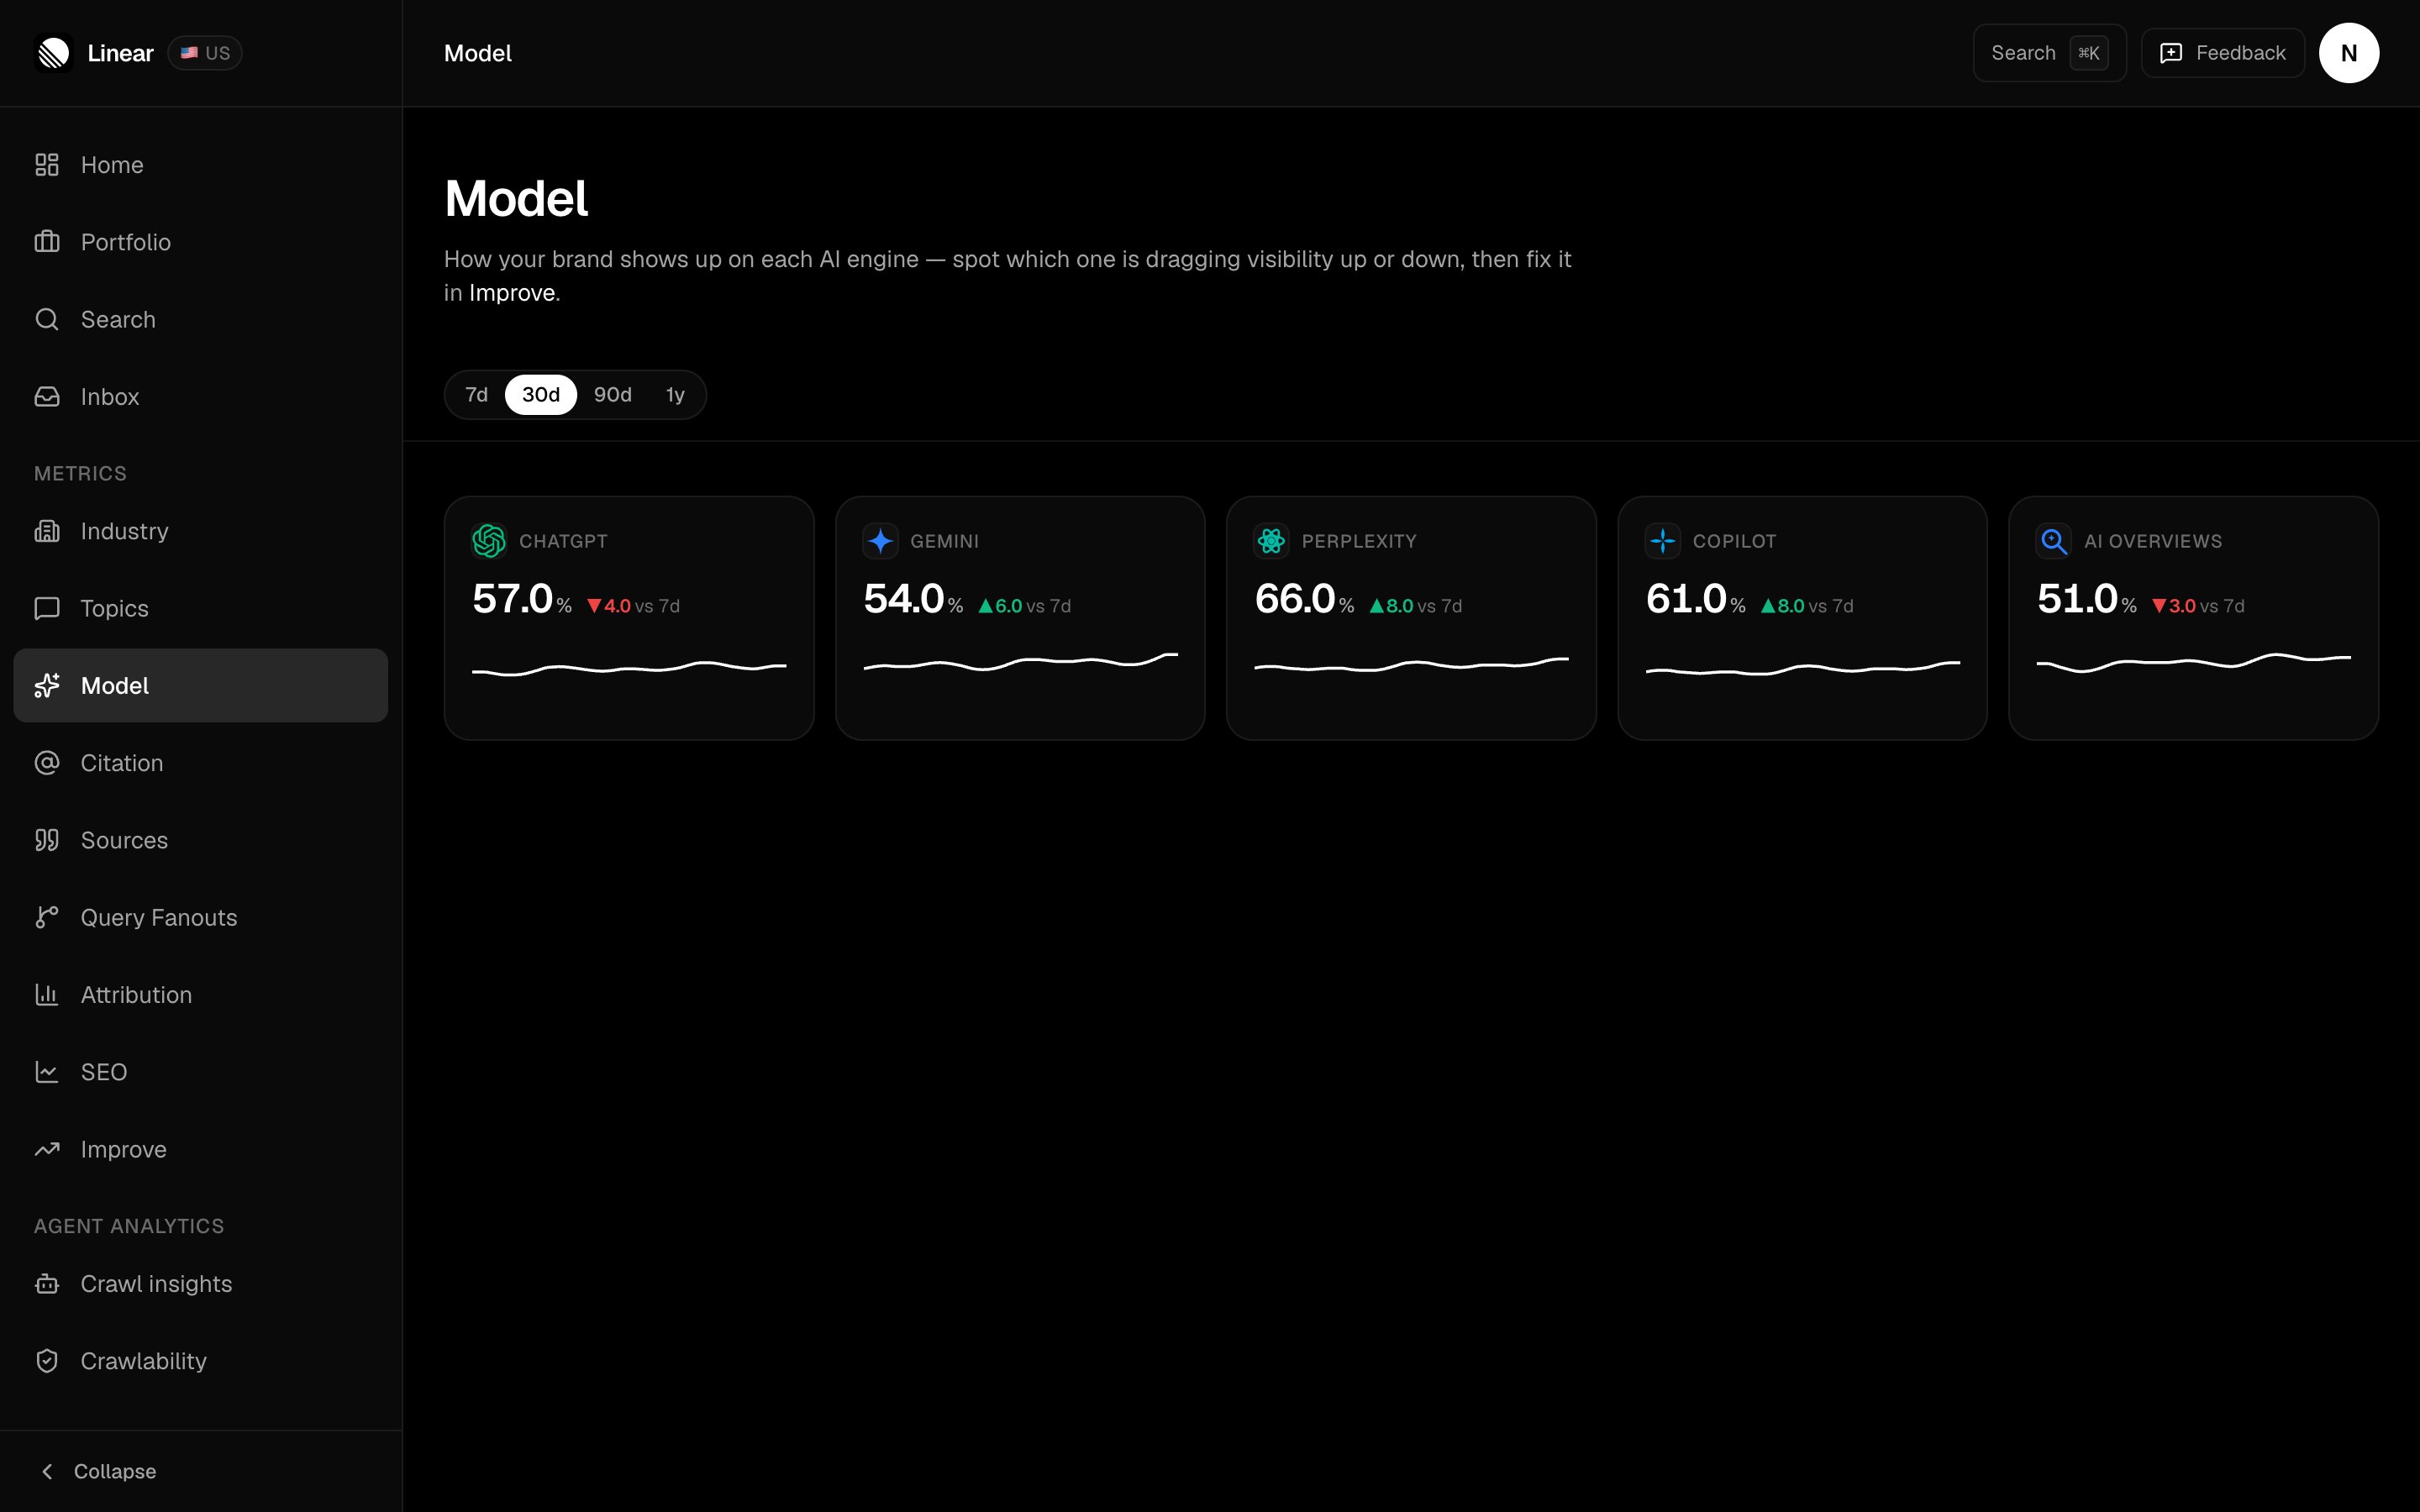
The same metric split five ways — Perplexity runs 15 points above AI Overviews on an identical prompt list.
Each metric page defines its number and tells you how to read it, including the cases that show a blank instead of a zero. Understanding AI answers covers the sampling behind all four.
Understanding your dashboard
Where each metric appears, and which panel to read first.
Understanding AI answers
The raw captured answers behind every number.
Industry
Share of voice, ranking, and the competitive quadrant.
Improve
Turn a weak metric into work you can ship.