

What’s in the header?
Four things, in reading order. A status pill next to your brand name. It reads Healthy, At risk, or Critical, based on how far your score moved across the window. It reads Scan in progress when today’s scan hasn’t finished. An engine status row. One pill per engine your plan tracks, plus any engine that has returned data, and a summary line: “all 6 responding”, “6 engines tracked” while one still waits on its first result, or “3 of 6 not responding”. Today, a one-line summary. It appears only when something meaningful moved — your visibility, a competitor’s share, or sentiment. Otherwise it hides rather than saying “all quiet”. Visibility Score, the hero number, with a change chip reading vs window start and a trend chart. The hero covers the whole window, so it won’t match the last point on the chart, which is a single day. Visibility Score explains the metric. All four, stacked in that order: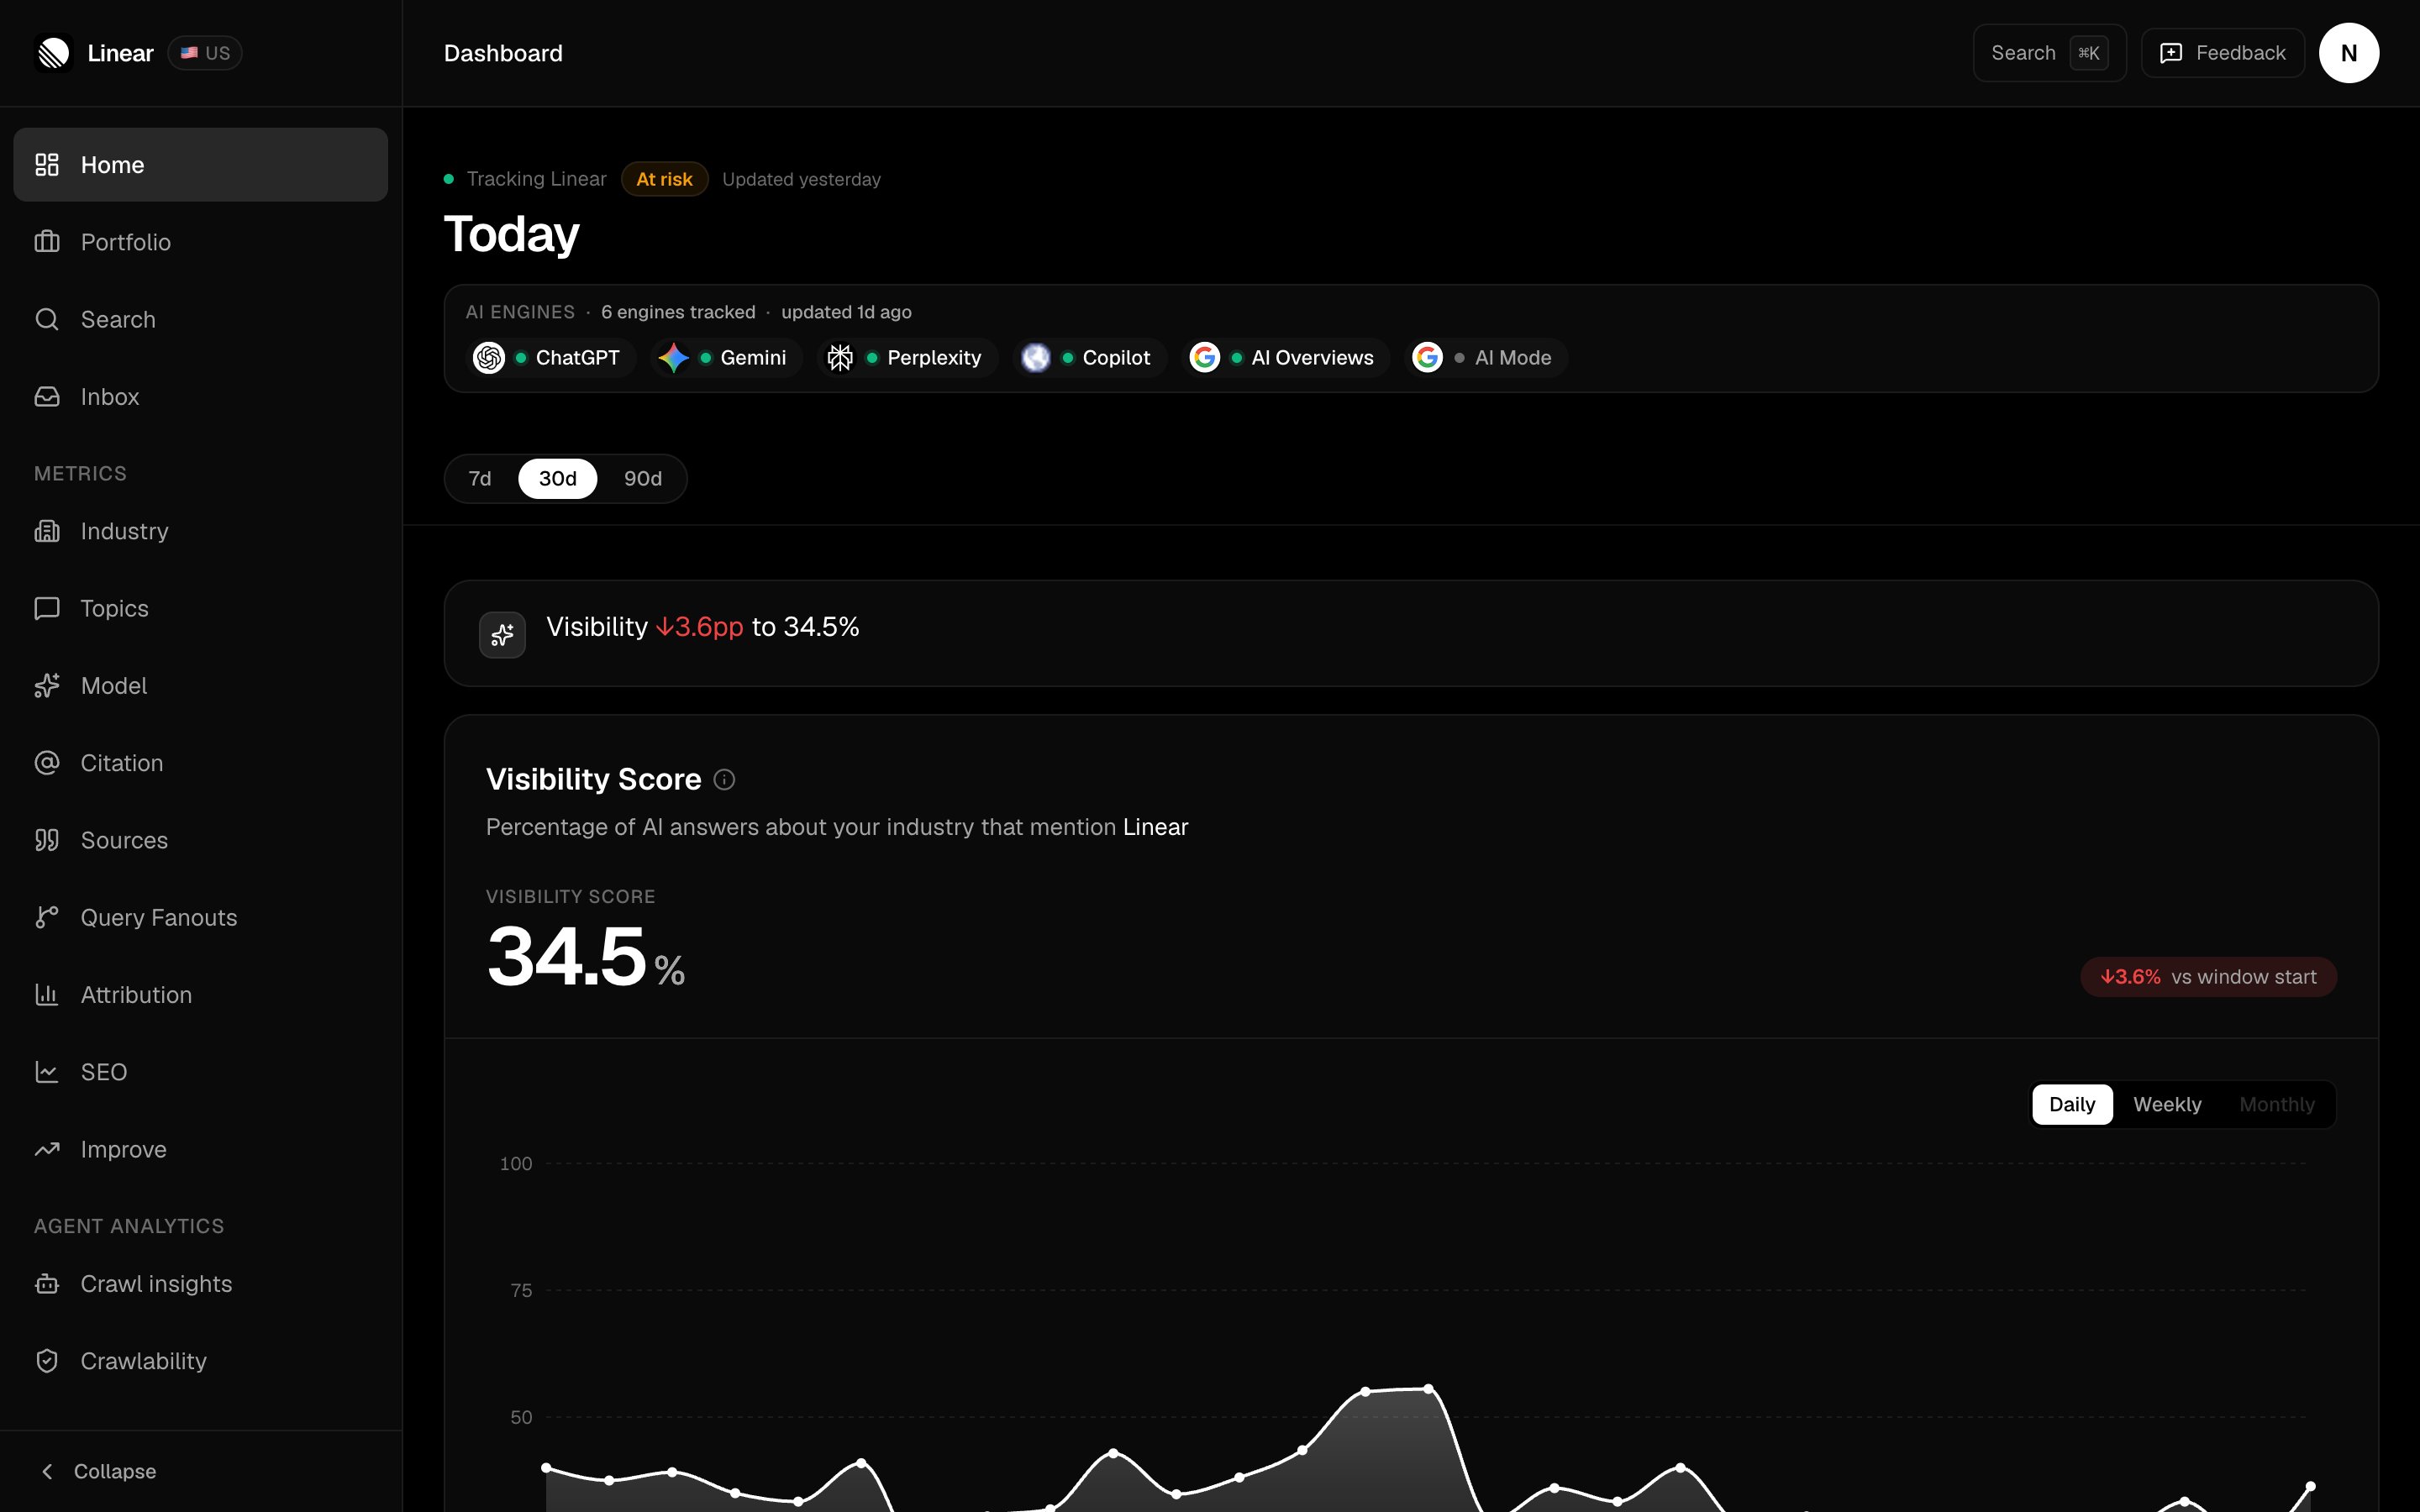
Check the engine row before the score. Five chips are lit here; AI Mode is grey because it's tracked on this plan but hasn't returned data yet.
Why does engine status matter so much?
Because a provider outage looks exactly like a visibility crash if you don’t check. A pill reads healthy when that engine returned answers in your latest scan. It reads down when the engine answered earlier in the window but returned nothing on the latest day. A grey pill reads Tracked — your plan covers that engine, but it hasn’t returned a first result for this brand yet. That’s not a failure, so it doesn’t count toward the “not responding” summary.An engine sitting at 0% isn’t the same as an engine that’s down. 0% means it answered and didn’t name you. That’s a real visibility problem, and Improve is where you fix it.
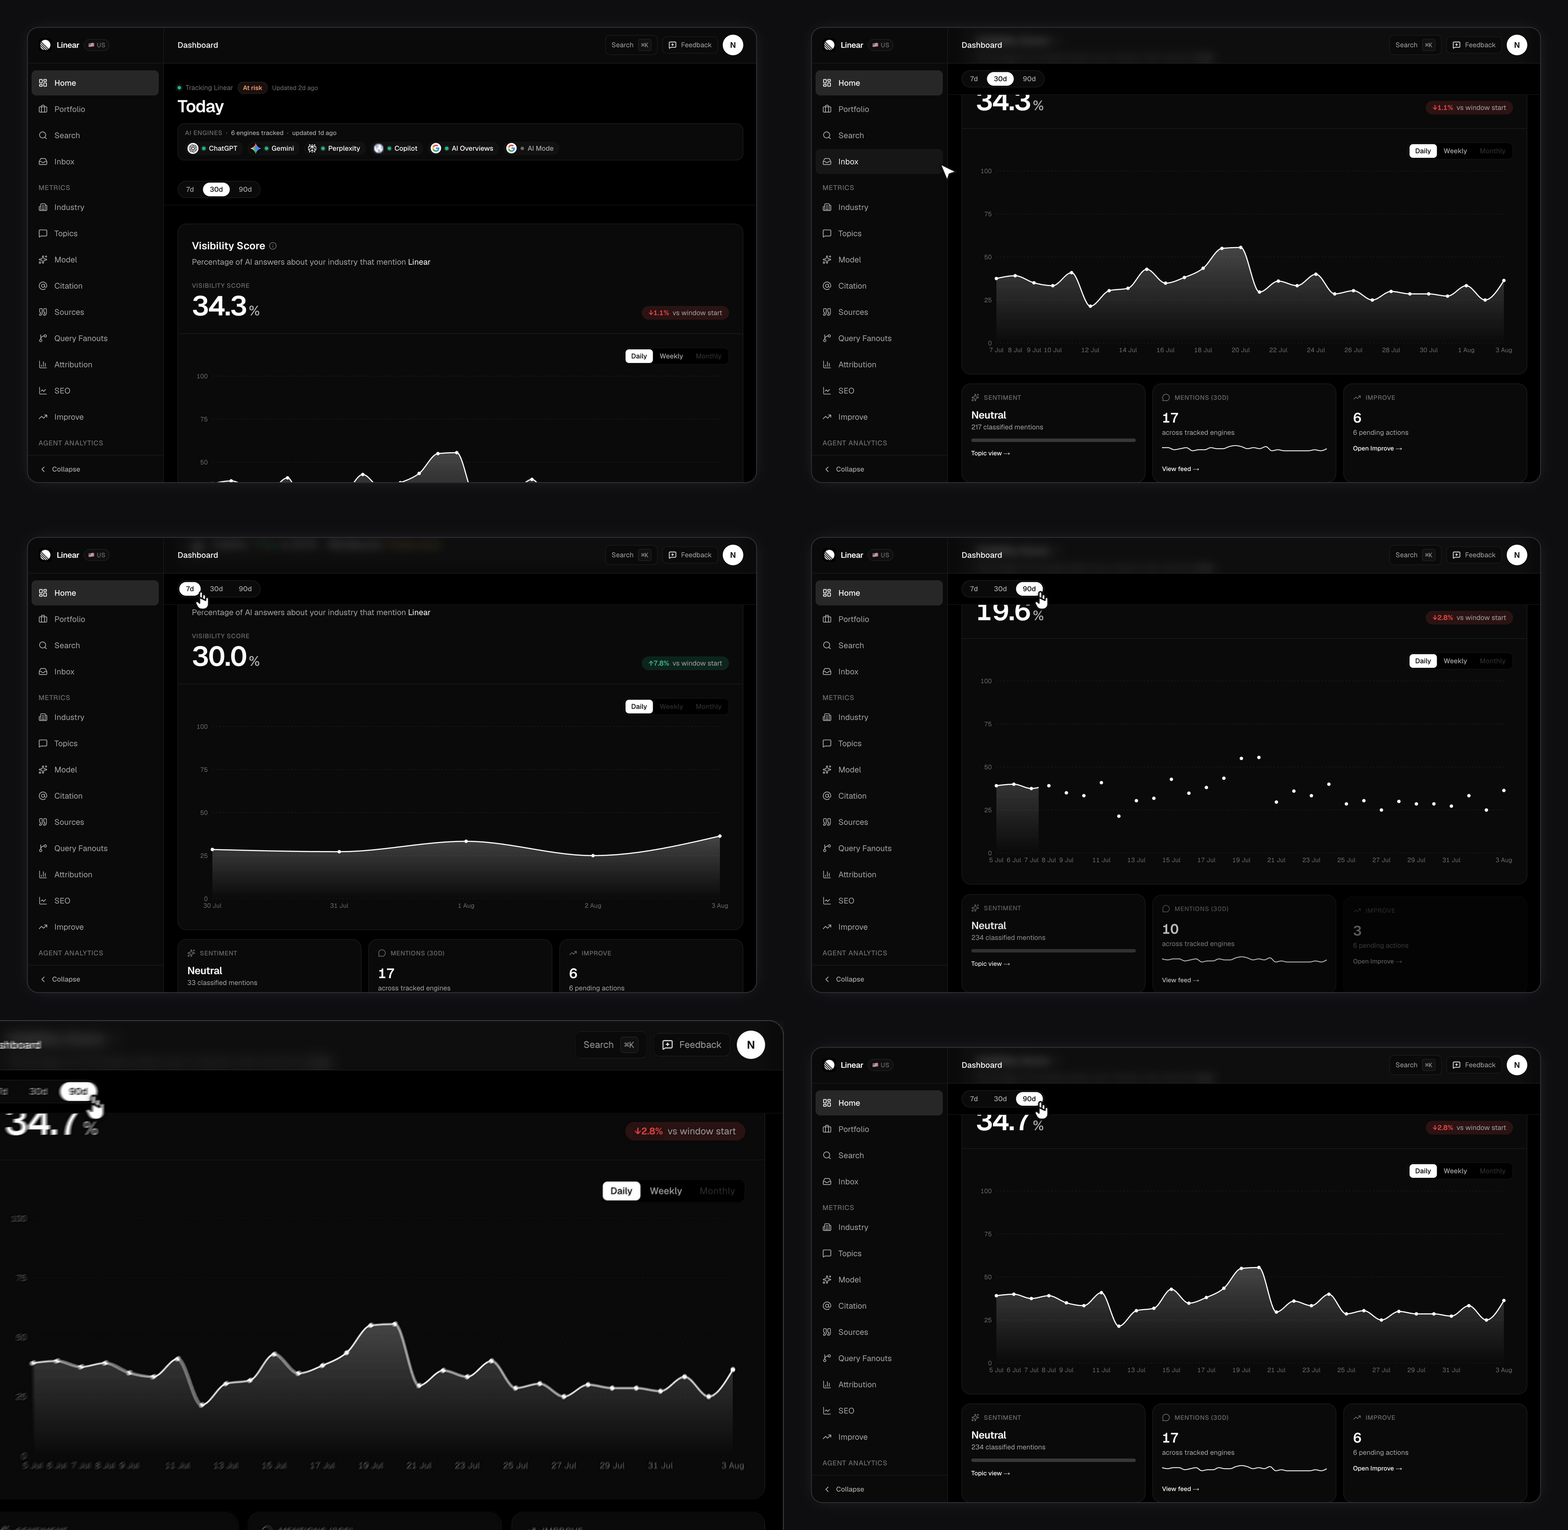
The three tiles
Below the hero sit Sentiment, Mentions, and Improve. Each links into its full view. Sentiment is the positive / neutral / negative split across classified mentions — see Sentiment. Mentions is always a 30-day count, whichever range tab you picked, so it stays comparable week to week. Improve is how many recommendations are still pending.What’s in the left column?
- AI attribution — sessions, conversions, and revenue from AI referrals. Appears once you’ve connected Google Analytics.
- Agent traffic — which AI crawlers hit your site. See Agent analytics.
- Top movers — your biggest engine drop and the fastest-rising competitor. Both stay hidden while nothing has really moved.
- Topic visibility — your strongest topics by Visibility Score. Full view on Topics and labels.
- Recent mentions — the newest answers that named you, with engine, sentiment, and the prompt behind them.
What’s in the right column?
- Brand industry ranking — share-of-voice bars against every brand the engines named in your category. Full view on Industry benchmarks, the metric itself on Share of voice.
- Alerts that fired — rules that triggered inside the window. Set them up on Alerts.
- Improve — your most pressing pending recommendations.
- Connect to unlock more — integrations you haven’t set up yet.