> ## Documentation Index
> Fetch the complete documentation index at: https://docs.fixaeo.com/llms.txt
> Use this file to discover all available pages before exploring further.
# Portfolio
> Compare every brand you track in one cross-brand view.
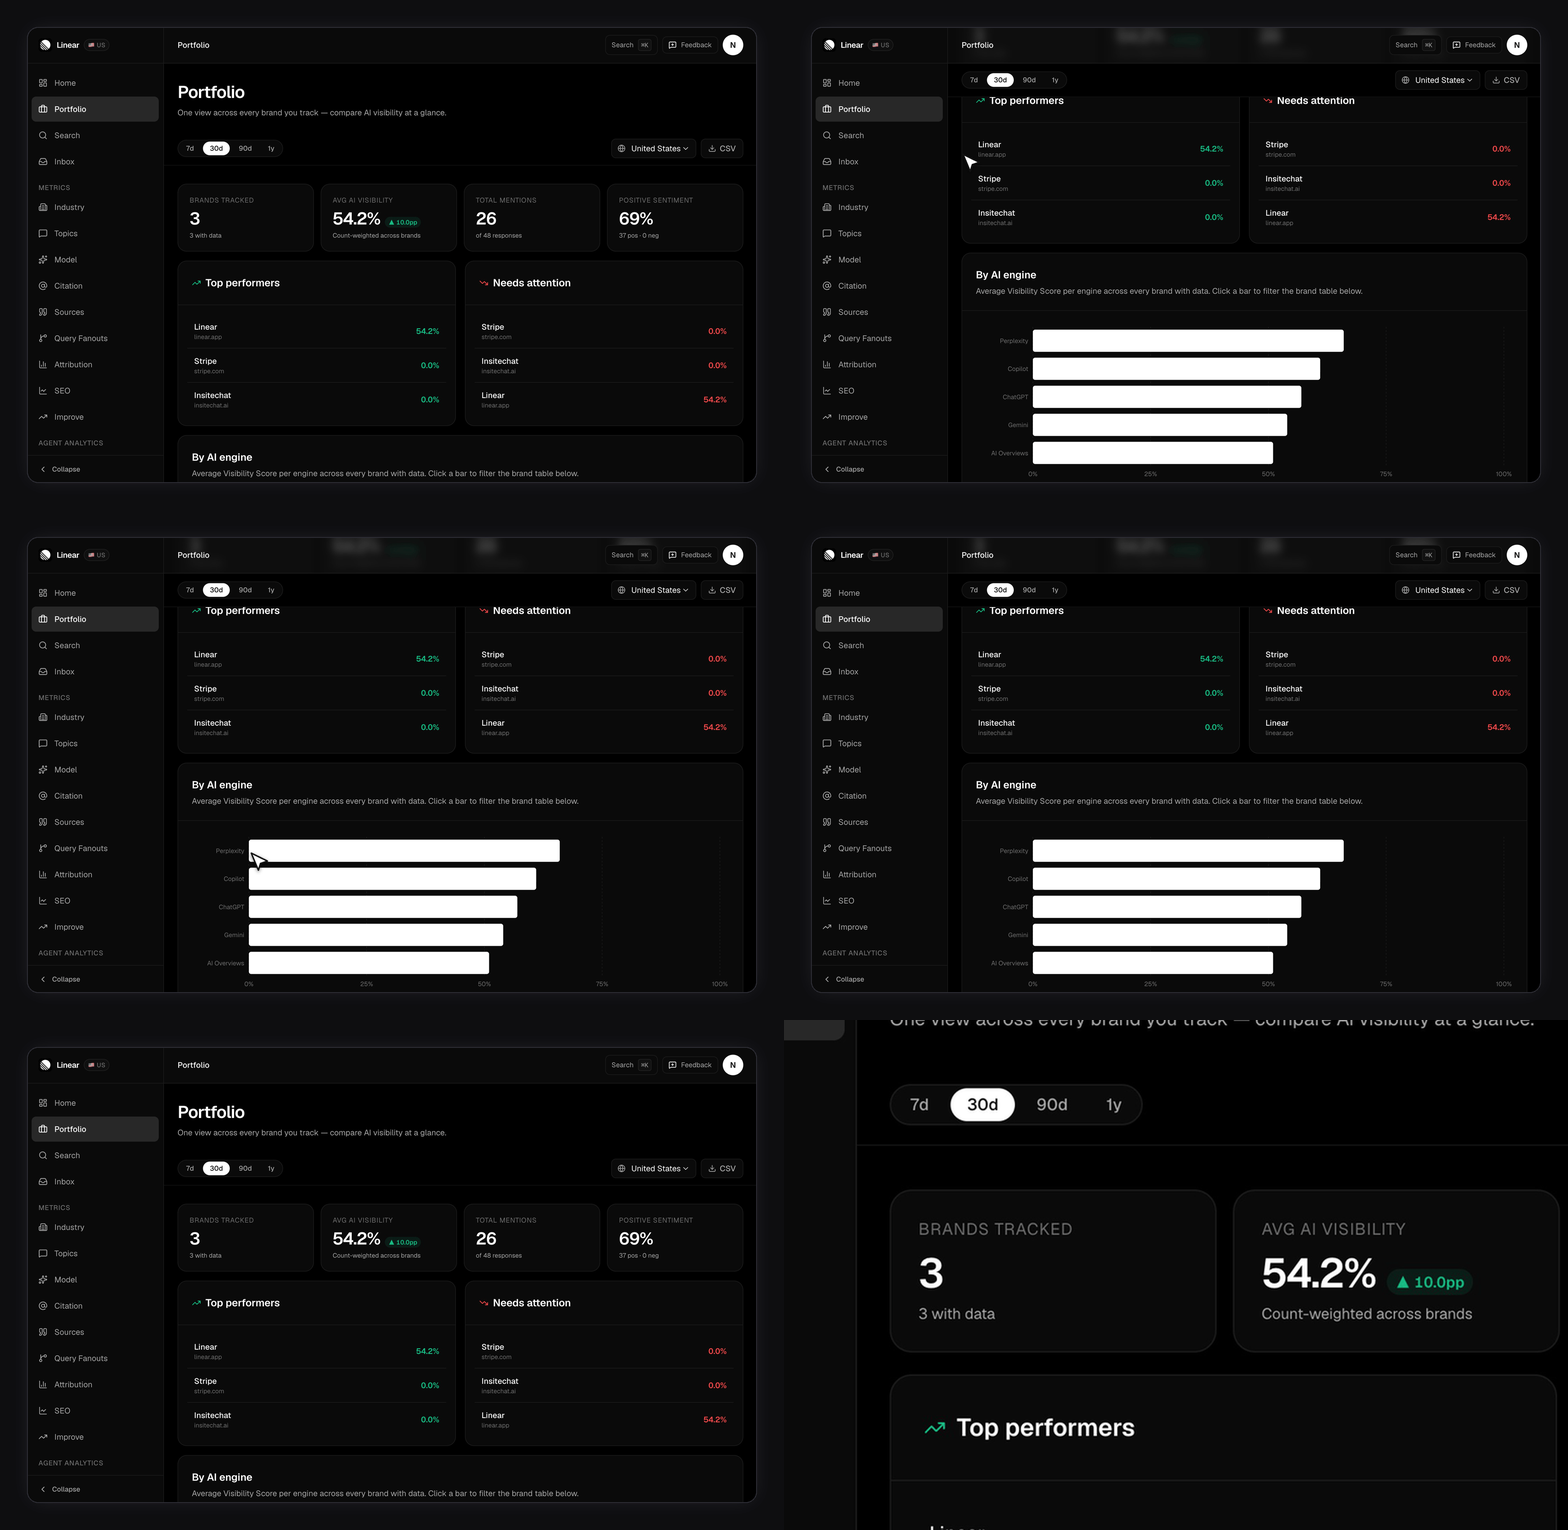
Portfolio is one page that rolls up every brand on your account into a single comparison.
It answers a question the per-brand dashboard can't: of the brands you're responsible for, which one needs your week? Every number on the page comes from the same daily scans each brand already runs.
 ## Who gets a Portfolio page?
Anyone tracking two or more brands. The sidebar link is hidden below that, and opening `/app/portfolio/` with one brand redirects you to your [dashboard](/dashboard). A rollup over a single brand is just a worse dashboard.
Free plans cap you at one brand, so Portfolio starts on Lite. Caps by plan are on [Plans and limits](/plans-and-limits), and adding brands is covered in [Managing brands](/managing-brands).
## What's on the page
Four blocks, in this order.
* **KPI tiles** — brands tracked, average AI visibility, total mentions, positive sentiment share.
* **Top performers and Needs attention** — your best and weakest brands by visibility.
* **By AI engine** — average visibility per engine across your brands.
* **All brands** — a sortable table of every brand with visibility, change, mentions, sentiment split, and last scan date.
Above them sits a filter bar: a range picker (7d, 30d, 90d, 1y), a country picker, and a CSV button.
## How do you read the numbers?
**Avg AI visibility** is how visible your brands are across the account as a whole. It's an account-level figure, so it won't always match the average of the percentages in the table below. [Visibility Score](/metrics/visibility-score) covers the metric itself.
Each brand contributes its **most recent scan inside the range**, not an average across the range. So switching from 7d to 90d doesn't smooth the numbers — it moves the period you're comparing against.
**Δ vs prev** compares that scan against the matching period immediately before, in percentage points. A dash means flat, not missing. The account-level delta only counts brands with data in both periods, so a brand added last week can't swing it.
Brands that haven't been scanned yet still appear, marked **Pending** with dashes instead of zeros. They're excluded from every average, so a new brand can't drag your numbers down before it has data.
## What doesn't roll up
Portfolio rolls up brand-level numbers only. These stay per brand: [prompts](/setting-up-prompts), [topics and labels](/topics-and-labels), [citations](/citations), [sources](/sources), and [Improve](/improve) recommendations. Click any row to drop into that brand.
Region is a filter, not an aggregate. The page shows one country at a time. Brands that don't track the selected country drop out of the table and out of the totals. They still appear in the country dropdown, so you can switch to a country where they are tracked.
The brand count on the page is the count **for the selected country**, not your account total. If you track five brands and three of them run in the UK, the US view says two. Check the country picker before you report that number to anyone.
Portfolio is scoped to your own login, and covers every brand on your account.
## Why do the same brands show up in both lists?
Both cards read the same ranked list from opposite ends. Track only a handful of brands and every one of them appears in both, just in opposite order.
Both cards rank on the visibility percentage printed beside each brand, so the order always agrees with the numbers you're reading.
## Reading the By AI engine chart
The bars show each engine's average visibility across your brands, strongest first.
Clicking a bar filters the table below to brands with any citations from that engine. Click it again, or the chip, to clear.
An engine your plan doesn't cover never appears, so the bars compare the engines you're entitled to, not all nine. See [Plans and limits](/plans-and-limits) for the per-tier split.
## Sorting and filtering the table
The table defaults to visibility, highest first. Click any header to re-sort by name, visibility, change, mentions, or last scan. Brands with data always rank above pending brands, in both directions. Sorting ascending won't fill the top of the table with brands that never scanned.
The search box next to the table matches the brand name, its domain, and its slug.
## Exporting to CSV
The CSV button downloads the current range and country as one row per brand.
Columns: `brand_slug`, `brand_name`, `domain`, `vertical`, `region`, `language`, `range_days`, `has_data`, `citation_rate_pct`, `citation_delta_pct`, `brand_mentions`, `total_responses`, `sentiment_pos`, `sentiment_neu`, `sentiment_neg`, `latest_scan_date`, `top_engine`, `top_engine_rate_pct`.
`citation_rate_pct` is the Visibility Score on a 0-to-100 scale, the same number the page shows. Pending brands get empty cells rather than zeros, so spreadsheet averages aren't diluted by brands that never scanned. The filename carries the country, range, and date, so two exports never overwrite each other. [Export your data](/export-your-data) covers every export in the app.
Use Portfolio to pick the brand, then [Industry benchmarks](/industry) to find who's beating it and [Improve](/improve) to get work you can ship this week.
## Related
* [Managing brands](/managing-brands) — adding, switching, and removing the brands this page rolls up.
* [Plans and limits](/plans-and-limits) — brand caps, the shared prompt pool, and scan cadence.
* [Visibility Score](/metrics/visibility-score) — the metric behind every percentage here.
## Who gets a Portfolio page?
Anyone tracking two or more brands. The sidebar link is hidden below that, and opening `/app/portfolio/` with one brand redirects you to your [dashboard](/dashboard). A rollup over a single brand is just a worse dashboard.
Free plans cap you at one brand, so Portfolio starts on Lite. Caps by plan are on [Plans and limits](/plans-and-limits), and adding brands is covered in [Managing brands](/managing-brands).
## What's on the page
Four blocks, in this order.
* **KPI tiles** — brands tracked, average AI visibility, total mentions, positive sentiment share.
* **Top performers and Needs attention** — your best and weakest brands by visibility.
* **By AI engine** — average visibility per engine across your brands.
* **All brands** — a sortable table of every brand with visibility, change, mentions, sentiment split, and last scan date.
Above them sits a filter bar: a range picker (7d, 30d, 90d, 1y), a country picker, and a CSV button.
## How do you read the numbers?
**Avg AI visibility** is how visible your brands are across the account as a whole. It's an account-level figure, so it won't always match the average of the percentages in the table below. [Visibility Score](/metrics/visibility-score) covers the metric itself.
Each brand contributes its **most recent scan inside the range**, not an average across the range. So switching from 7d to 90d doesn't smooth the numbers — it moves the period you're comparing against.
**Δ vs prev** compares that scan against the matching period immediately before, in percentage points. A dash means flat, not missing. The account-level delta only counts brands with data in both periods, so a brand added last week can't swing it.
Brands that haven't been scanned yet still appear, marked **Pending** with dashes instead of zeros. They're excluded from every average, so a new brand can't drag your numbers down before it has data.
## What doesn't roll up
Portfolio rolls up brand-level numbers only. These stay per brand: [prompts](/setting-up-prompts), [topics and labels](/topics-and-labels), [citations](/citations), [sources](/sources), and [Improve](/improve) recommendations. Click any row to drop into that brand.
Region is a filter, not an aggregate. The page shows one country at a time. Brands that don't track the selected country drop out of the table and out of the totals. They still appear in the country dropdown, so you can switch to a country where they are tracked.
The brand count on the page is the count **for the selected country**, not your account total. If you track five brands and three of them run in the UK, the US view says two. Check the country picker before you report that number to anyone.
Portfolio is scoped to your own login, and covers every brand on your account.
## Why do the same brands show up in both lists?
Both cards read the same ranked list from opposite ends. Track only a handful of brands and every one of them appears in both, just in opposite order.
Both cards rank on the visibility percentage printed beside each brand, so the order always agrees with the numbers you're reading.
## Reading the By AI engine chart
The bars show each engine's average visibility across your brands, strongest first.
Clicking a bar filters the table below to brands with any citations from that engine. Click it again, or the chip, to clear.
An engine your plan doesn't cover never appears, so the bars compare the engines you're entitled to, not all nine. See [Plans and limits](/plans-and-limits) for the per-tier split.
## Sorting and filtering the table
The table defaults to visibility, highest first. Click any header to re-sort by name, visibility, change, mentions, or last scan. Brands with data always rank above pending brands, in both directions. Sorting ascending won't fill the top of the table with brands that never scanned.
The search box next to the table matches the brand name, its domain, and its slug.
## Exporting to CSV
The CSV button downloads the current range and country as one row per brand.
Columns: `brand_slug`, `brand_name`, `domain`, `vertical`, `region`, `language`, `range_days`, `has_data`, `citation_rate_pct`, `citation_delta_pct`, `brand_mentions`, `total_responses`, `sentiment_pos`, `sentiment_neu`, `sentiment_neg`, `latest_scan_date`, `top_engine`, `top_engine_rate_pct`.
`citation_rate_pct` is the Visibility Score on a 0-to-100 scale, the same number the page shows. Pending brands get empty cells rather than zeros, so spreadsheet averages aren't diluted by brands that never scanned. The filename carries the country, range, and date, so two exports never overwrite each other. [Export your data](/export-your-data) covers every export in the app.
Use Portfolio to pick the brand, then [Industry benchmarks](/industry) to find who's beating it and [Improve](/improve) to get work you can ship this week.
## Related
* [Managing brands](/managing-brands) — adding, switching, and removing the brands this page rolls up.
* [Plans and limits](/plans-and-limits) — brand caps, the shared prompt pool, and scan cadence.
* [Visibility Score](/metrics/visibility-score) — the metric behind every percentage here.