> ## Documentation Index
> Fetch the complete documentation index at: https://docs.fixaeo.com/llms.txt
> Use this file to discover all available pages before exploring further.
# Model
> Your Visibility Score, split by AI engine.
Model is your [Visibility Score](/metrics/visibility-score) broken out one engine at a time.
A single overall score hides the thing you can act on. A brand at 30% is rarely 30% everywhere. It's usually strong on two engines, invisible on a third, and drifting on a fourth. This page puts each engine on its own card so you can see which one is moving the average, and in which direction.
## What's on each card
Every card carries four things: the engine's name and icon, its latest score, a change chip against a week ago, and a small trend line across the range you picked.
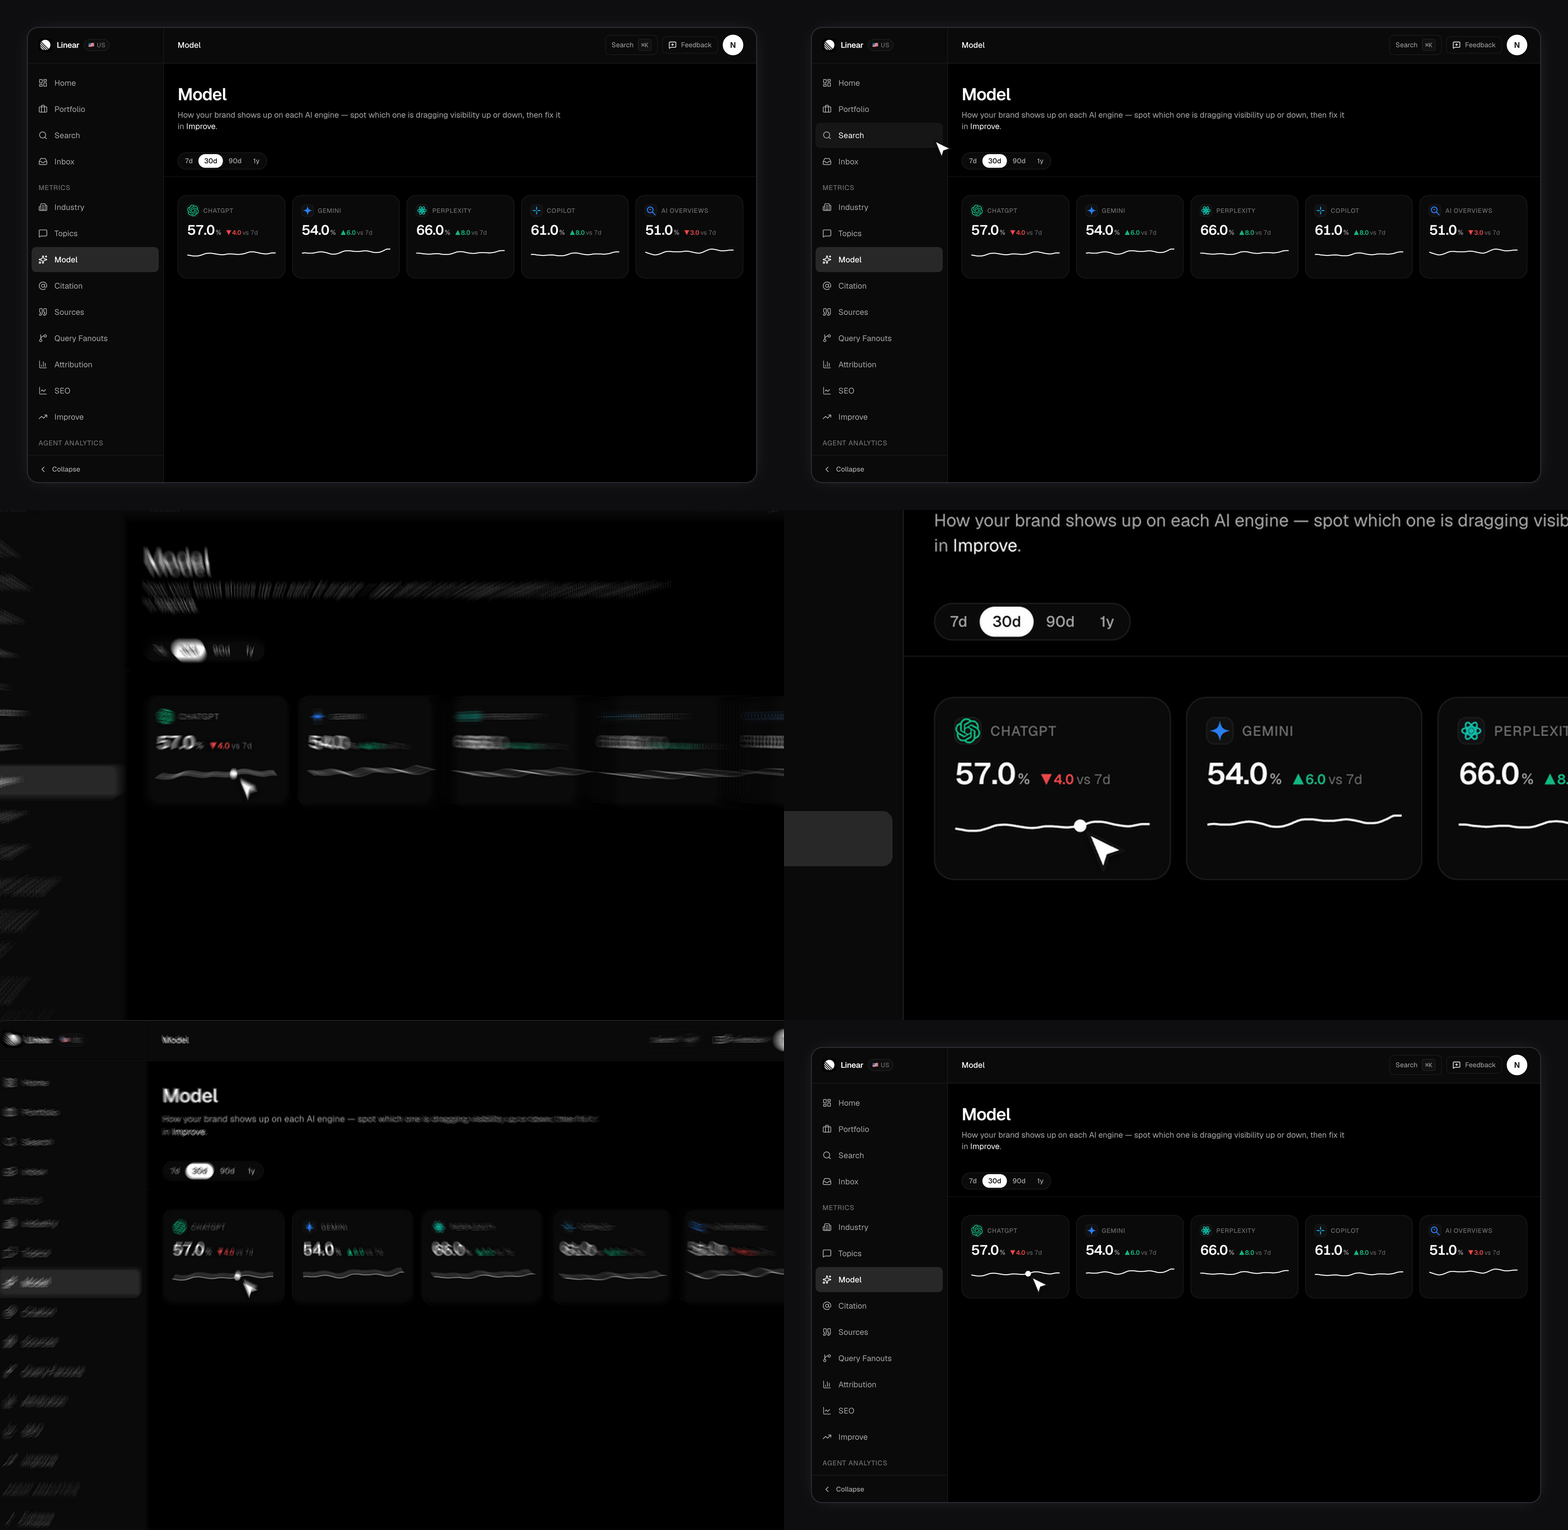 The latest score is the most recent day that engine actually produced data, not simply the last day in the window. If an engine failed yesterday, the card falls back to the last day it worked instead of printing a zero it didn't earn. The same rule applies inside the trend line. Missing days are drawn as gaps, not as drops to the floor.
That matters more than it sounds. An engine that went down for a day looks exactly like a brand collapse if its missing day is drawn as a zero.
## How do you read the change chip?
The chip shows how that engine's score has moved over the past week, in percentage points.
If the engine has no usable day to compare against, the chip is left off entirely rather than measured against nothing. Small moves are labelled flat instead of being given an arrow, so day-to-day noise doesn't read as a trend.
## Which engines appear here?
Only engines that returned at least one day of data inside the window.
Cards keep a fixed order so they don't reshuffle when you switch ranges. The set you could ever see is set by your plan, not by this page. Lite and Growth scan six engines. Enterprise scans nine. Free accounts get no scheduled scans at all, so there's nothing here to draw. [Plans and limits](/plans-and-limits) has the full split.
An engine missing from this page but present on your plan usually means it hasn't produced a result for this brand yet. The engine health rail on your [dashboard](/dashboard) is the better place to tell "not scanned yet" apart from "scanned and failing".
## Why does an engine sit at zero?
Zero and absent mean different things, and the difference matters.
A card showing zero means that engine answered your prompts and named you in none of them. That's a visibility problem, and it's real. An engine with no card at all means it produced no data in the window. That's a coverage problem, and chasing content won't fix it.
When a card is genuinely at zero, [Query fanouts](/fanouts) is the fastest next step. It shows the sub-questions that engine actually answered for the prompt, which usually explains the gap better than the score does.
## Range, brand, and region
The range tabs cover 7d, 30d, 90d and 1y, and default to 30 days. The trend line redraws over whichever window you pick, so a card's sparkline on 1y is a year of daily points, not a fixed 30.
A trend line needs more than a single day of data before it draws. Until then the card shows a dashed placeholder rather than a lone dot. Lines fill in over the first few days of a new brand, or of a newly added engine.
The page follows the brand selected in the app, and also accepts a `?slug=` parameter so you can link straight to one brand's engine view. See [Managing brands](/managing-brands).
Model shows one region at a time — your brand's primary region. There's no region picker on this page, so a brand tracking two countries shows one of them here. [Industry](/industry) and [Citations](/citations) let you choose.
## What this page doesn't cover
Model answers "where am I strong", not "why". It has no prompt list, no topic split, and no citation data. Pair it with the pages that do.
Read the cards as a spread, not as one number. A 20-point gap between your best and worst engine is a content problem you can name. If every engine sits in the same narrow band, your whole category reads you the same way. Then the lever is your prompt list, not any single engine.
Per-engine scores are available over the API as well. See the [API reference](/api/introduction) for the endpoint and its parameters.
The metric on these cards, and how the ratio is built.
Why a given engine answered the way it did.
Turns a weak engine into a list of things to write.
How Visibility Score sits alongside the other three metrics.
The latest score is the most recent day that engine actually produced data, not simply the last day in the window. If an engine failed yesterday, the card falls back to the last day it worked instead of printing a zero it didn't earn. The same rule applies inside the trend line. Missing days are drawn as gaps, not as drops to the floor.
That matters more than it sounds. An engine that went down for a day looks exactly like a brand collapse if its missing day is drawn as a zero.
## How do you read the change chip?
The chip shows how that engine's score has moved over the past week, in percentage points.
If the engine has no usable day to compare against, the chip is left off entirely rather than measured against nothing. Small moves are labelled flat instead of being given an arrow, so day-to-day noise doesn't read as a trend.
## Which engines appear here?
Only engines that returned at least one day of data inside the window.
Cards keep a fixed order so they don't reshuffle when you switch ranges. The set you could ever see is set by your plan, not by this page. Lite and Growth scan six engines. Enterprise scans nine. Free accounts get no scheduled scans at all, so there's nothing here to draw. [Plans and limits](/plans-and-limits) has the full split.
An engine missing from this page but present on your plan usually means it hasn't produced a result for this brand yet. The engine health rail on your [dashboard](/dashboard) is the better place to tell "not scanned yet" apart from "scanned and failing".
## Why does an engine sit at zero?
Zero and absent mean different things, and the difference matters.
A card showing zero means that engine answered your prompts and named you in none of them. That's a visibility problem, and it's real. An engine with no card at all means it produced no data in the window. That's a coverage problem, and chasing content won't fix it.
When a card is genuinely at zero, [Query fanouts](/fanouts) is the fastest next step. It shows the sub-questions that engine actually answered for the prompt, which usually explains the gap better than the score does.
## Range, brand, and region
The range tabs cover 7d, 30d, 90d and 1y, and default to 30 days. The trend line redraws over whichever window you pick, so a card's sparkline on 1y is a year of daily points, not a fixed 30.
A trend line needs more than a single day of data before it draws. Until then the card shows a dashed placeholder rather than a lone dot. Lines fill in over the first few days of a new brand, or of a newly added engine.
The page follows the brand selected in the app, and also accepts a `?slug=` parameter so you can link straight to one brand's engine view. See [Managing brands](/managing-brands).
Model shows one region at a time — your brand's primary region. There's no region picker on this page, so a brand tracking two countries shows one of them here. [Industry](/industry) and [Citations](/citations) let you choose.
## What this page doesn't cover
Model answers "where am I strong", not "why". It has no prompt list, no topic split, and no citation data. Pair it with the pages that do.
Read the cards as a spread, not as one number. A 20-point gap between your best and worst engine is a content problem you can name. If every engine sits in the same narrow band, your whole category reads you the same way. Then the lever is your prompt list, not any single engine.
Per-engine scores are available over the API as well. See the [API reference](/api/introduction) for the endpoint and its parameters.
The metric on these cards, and how the ratio is built.
Why a given engine answered the way it did.
Turns a weak engine into a list of things to write.
How Visibility Score sits alongside the other three metrics.